Toronto · Wednesday, September 2, 2026
The storm,
as told by 911 calls
Every storm-related call Toronto Police and Toronto Fire logged on September 2, replayed on the map at the minute it came in. Press play and watch two waves cross the city.
By the numbers
One day, 818 calls
Hour by hour
Two waves, one lull
The first wires-down call lands in West Humber-Clairville at 4:30. Half an hour later the cluster is over Pelmo Park and York University Heights. By 6 pm it is the Annex, Rosedale and Lawrence Park South. Six elevator rescues between 5:04 and 6:57 as the power goes.
After a 7 pm lull, the second round stops moving. Downsview, Englemount-Lawrence, Forest Hill North and Bedford Park-Nortown take it for three hours. The half hour from 9:30 pm alone logs 21 wires-down calls.
Call types
What spiked, what went quiet
| Wires down (fire + police) | 125 | typical 1 |
| Police hazard calls | 71 | typical 12 |
| Fire alarm check calls | 46 | typical 1 |
| Water problem | 26 | typical 1 |
| Elevator rescues | 9 | typical 5 |
| Transformer or pole fires | 6 | rare |
| Noisy party calls | 0 | typical 4 |
| Theft in progress | 0 | typical 3 |
| Break and enter | 5 | typical 8 |
| Impaired driver | 7 | typical 10 |
| Arrests | 10 | typical 15 |
| Medical (fire/EMS) | 130 | typical 139 |
Storm day against the Aug 12 to Sep 1 daily average. Counts are calls for service as published by the agencies, not confirmed incidents.
Neighbourhoods
Where it hit
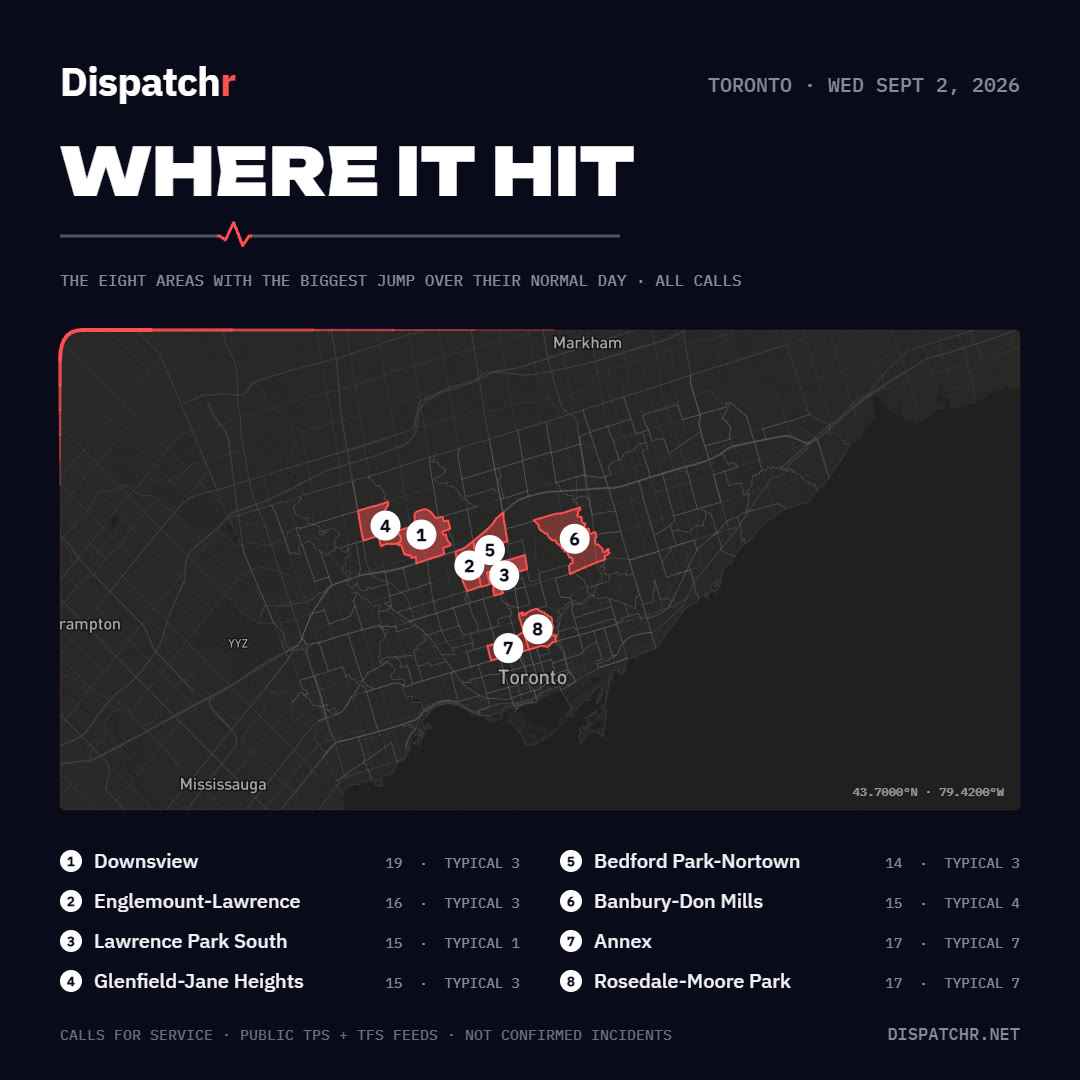
- Downsview19 · typical 3
- Englemount-Lawrence16 · typical 3
- Lawrence Park South15 · typical 1
- Glenfield-Jane Heights15 · typical 3
- Bedford Park-Nortown14 · typical 3
- Banbury-Don Mills15 · typical 4
- Annex17 · typical 7
- Rosedale-Moore Park17 · typical 7
Every one of these areas has its own page in the app, with the recent calls and a boundary map. Open Downsview to start.
Thursday, September 3
The morning after
Alarms trip building by building as the power returns. The day after the storm still outranks every other day this year except the storm itself and one day in August.
Dispatchr
See what's happening near you
The same feeds that made this page, on a map you can filter by neighbourhood, call type and priority. Toronto police and fire, and more than 20 other cities. Notifications for your area, no account required. Weekly activity reports by email if you want them.
Calls appear as the agencies publish them. Treat the map as recent, never live.
Free account for notifications and reports. The web version works on any phone.
How this was made
The data
Where do the calls come from?
Toronto Police Service and Toronto Fire Services both publish calls for service. Dispatchr ingests those public feeds, standardizes the call types, and places each call on the map. This page uses every call logged on September 2 and 3, 2026, with the Aug 12 to Sep 1 daily average as the comparison.
What counts as a "storm-signature" call?
Wires down, water problems, police hazard and damage calls, fire alarm check calls, elevator rescues, fires and transformer or pole fires. The replay shows those 341 calls. The 818 total includes everything else the two agencies logged that day, medical calls included.
Why don't these numbers match the news?
News reports count outages, rescues and damage. This page counts calls. One downed line can produce three calls, and a call is not a confirmed incident. The feeds also omit some call types the agencies don't publish, so the true total is higher than 818.
What does "busiest day of 2026" mean?
The highest daily total in Dispatchr's Toronto records from January 1 to September 3, 2026. Sept 2 logged 818 calls; the next-busiest day, August 1, logged 640.