63,765
Dispatched calls tracked
13
Cities covered
688
Neighbourhood pages
August 2026 highlights
The standouts across all 13 covered cities this period — tap any card for the full picture.
🏆 Busiest area
Southeast Dallas
1,868 calls · Dallas
More dispatched calls than any other neighbourhood in any covered city in August.
📈 RisingOakley
+157% vs July · Cincinnati
The biggest month-over-month jump in dispatched calls network-wide.
🌙 Night owlWest Dallas
34% of calls overnight · Dallas
Highest share of calls between 22:00 and 04:00 of any covered neighbourhood.
🎉 Weekend-leaningNorth Beach
1.8× weekday pace · San Francisco
Highest weekend-vs-weekday calls per day across covered cities.
💎 Rare sightingFire - Institution
seen 2× citywide · Toronto
The least common call category recorded anywhere in August.
Featured
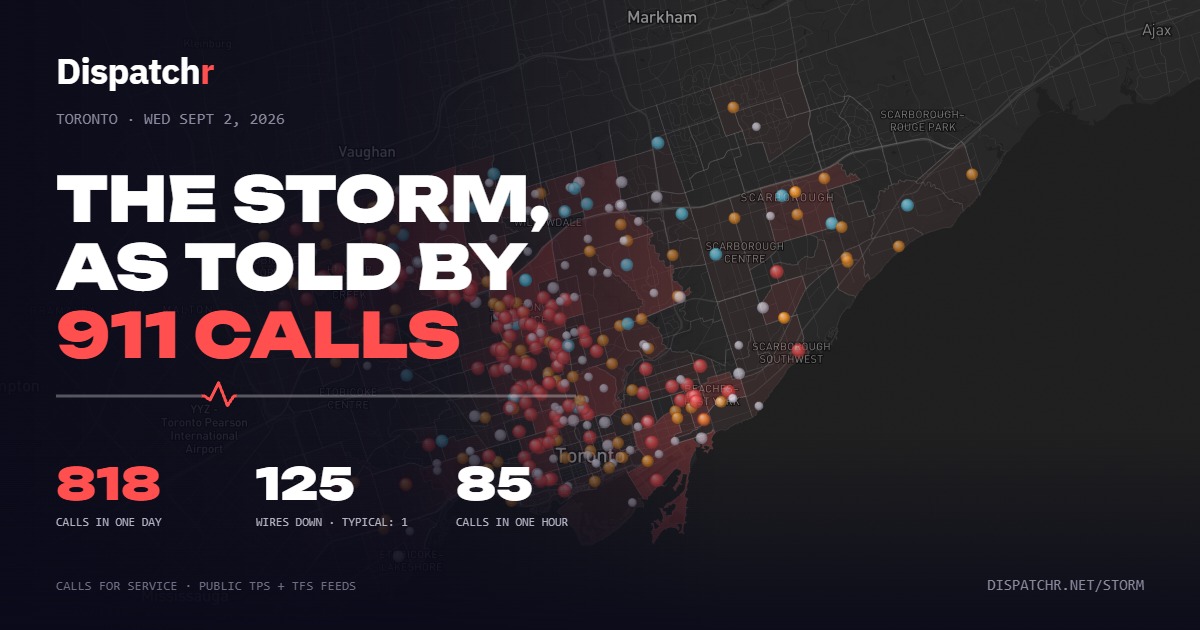
Toronto · Sept 2, 2026
The storm, as told by 911 calls
Replay September 2, 2026 minute by minute: 818 police and fire calls in one day, 125 wires down, two waves across the city.
Replay the storm →
Cities
→
Dallas
23,762 calls · 24 neighbourhoods · busiest hour 22:00 · top: Other Call
→
Toronto
16,042 calls · 158 neighbourhoods · busiest hour 12:00 · top: Medical
→
Cincinnati
6,999 calls · 45 neighbourhoods · busiest hour 23:00 · top: Unknown Trouble
→
San Francisco
5,774 calls · 37 neighbourhoods · busiest hour 17:00 · top: Passing Call (Radio Check)
→
Detroit
3,964 calls · 54 neighbourhoods · busiest hour 4:00 · top: Disturbance
→
Nashville
2,883 calls · 27 neighbourhoods · busiest hour 23:00 · top: Burglary Alarm
→
Las Vegas
2,771 calls · 52 neighbourhoods · busiest hour 14:00 · top: Accident
→
Medicine Hat
800 calls · 28 neighbourhoods · top: Bylaw
→
Vancouver
217 calls · 22 neighbourhoods · top: Other Theft
→
Brampton
206 calls · 70 neighbourhoods · busiest hour 1:00 · top: Assault
→
Mississauga
167 calls · 43 neighbourhoods · busiest hour 2:00 · top: Assault
→
Vaughan
91 calls · 30 neighbourhoods · top: Theft Over $5000 (Vehicle)
Partial month — the feed did not cover all of August
→
Chicago
89 calls · 98 neighbourhoods · top: Battery
Partial month — the feed did not cover all of August
More cities are added as their data feeds are verified and cleared for publication.
Guides
What call types mean
Reading neighbourhood stats
What is a priority call?
Dispatch data ≠ crime stats
All guides →
How this works
Everything here is an aggregate for a labeled calendar month — counts, category breakdowns, and time patterns from official public agency feeds, attributed to neighbourhoods by their official boundaries. No individual events or addresses. Full detail in the methodology.