Dispatchr Open the app

Toronto · Neighbourhood dispatch report

Yorkdale-Glen ParkRecent emergency dispatch activity in Toronto's Yorkdale-Glen Park neighbourhood

Data period: August 1 – 31, 2026 · refreshed monthly Rank: #30 of 158 by call volume
122 ▲3%
Dispatched calls
8
Priority calls (P1–P2)
1.7×
vs citywide median
3.9
Avg calls / weekday
4.0
Avg calls / weekend day

The picture in August 2026
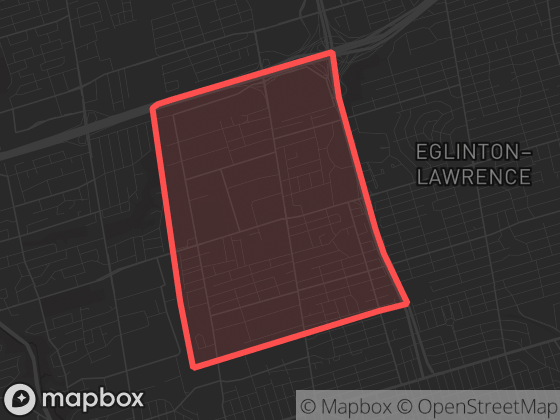
Map of Yorkdale-Glen Park in Toronto with its official boundary outlined

In August 2026, Yorkdale-Glen Park recorded 122 dispatched calls — above the citywide median (ranked 30 of 158 neighbourhoods by volume). The largest single category was Medical, at 26% of all calls in the area. Weekday and weekend days averaged a similar number of calls (3.9 vs 4.0 per day), with activity peaking around 19:00 local time. By the area's own recent standards, that is a typical month.

Neighbourhood attribution uses the official boundary polygon shown here; calls without reliable coordinates are excluded from neighbourhood totals.

Monthly history

December 2025 — 177 calls177January 2026 — 121 callsFebruary 2026 — 112 callsMarch 2026 — 116 callsApril 2026 — 111 calls111May 2026 — 123 callsJune 2026 — 123 callsJuly 2026 — 118 callsAugust 2026 — 122 calls122December 2025August 2026

Dispatched calls per month in Yorkdale-Glen Park since December 2025. Hover a point for the exact count.

MonthCallsPriority
August 20261227%
July 202611814%
June 202612310%
May 20261239%
April 20261115%
March 202611612%
February 20261126%
January 20261214%
December 20251778%

Featured

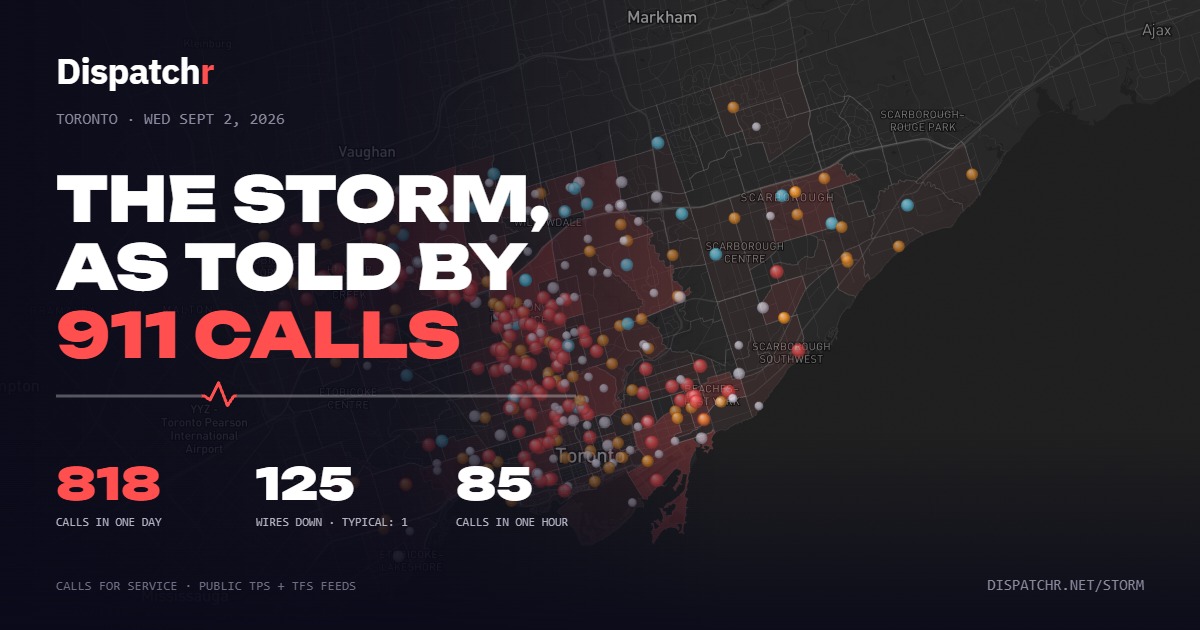
Map of Toronto with every storm-related 911 call from September 2, 2026 plotted as glowing dots
Toronto · Sept 2, 2026
The storm, as told by 911 calls
Replay September 2, 2026 minute by minute: 818 police and fire calls in one day, 125 wires down, two waves across the city.
Replay the storm →

Top call types

Full breakdown — all 32 call categories
Medical32
Arrest16
Impaired Driver8
Unknown Trouble8
Assault6
Traffic Injury6
Disorderlies6
Dispute4
Building Alarm4
Hazard3
Theft3
+ 21 rarer categories with fewer than 3 calls each (26 calls combined)

New to dispatch data? Read what the call types mean and how to read neighbourhood statistics.

Time of day

00:00–00:59 — 5 calls500h01:00–01:59 — 3 calls302:00–02:59 — 5 calls503:00–03:59 — 1 calls103h04:00–04:59 — 2 calls205:00–05:59 — 5 calls506:00–06:59 — 1 calls106h07:00–07:59 — 8 calls808:00–08:59 — 1 calls109:00–09:59 — 3 calls309h10:00–10:59 — 3 calls311:00–11:59 — 6 calls612:00–12:59 — 7 calls712h13:00–13:59 — 5 calls514:00–14:59 — 6 calls615:00–15:59 — 4 calls415h16:00–16:59 — 6 calls617:00–17:59 — 6 calls618:00–18:59 — 6 calls618h19:00–19:59 — 10 calls1020:00–20:59 — 9 calls921:00–21:59 — 6 calls621h22:00–22:59 — 6 calls623:00–23:59 — 8 calls8

Calls by hour (local time), August 1 – 31, 2026. The highlighted bar is the busiest hour.

00:00 — weekday avg 0.1, weekend avg 0.2 calls/day00h01:00 — weekday avg 0.0, weekend avg 0.2 calls/day02:00 — weekday avg 0.2, weekend avg 0.1 calls/day03:00 — weekday avg 0.0, weekend avg 0.0 calls/day03h04:00 — weekday avg 0.0, weekend avg 0.1 calls/day05:00 — weekday avg 0.2, weekend avg 0.1 calls/day06:00 — weekday avg 0.0, weekend avg 0.1 calls/day06h07:00 — weekday avg 0.3, weekend avg 0.2 calls/day08:00 — weekday avg 0.0, weekend avg 0.0 calls/day09:00 — weekday avg 0.1, weekend avg 0.1 calls/day09h10:00 — weekday avg 0.1, weekend avg 0.1 calls/day11:00 — weekday avg 0.2, weekend avg 0.1 calls/day12:00 — weekday avg 0.2, weekend avg 0.2 calls/day12h13:00 — weekday avg 0.1, weekend avg 0.2 calls/day14:00 — weekday avg 0.2, weekend avg 0.2 calls/day15:00 — weekday avg 0.2, weekend avg 0.0 calls/day15h16:00 — weekday avg 0.1, weekend avg 0.3 calls/day17:00 — weekday avg 0.0, weekend avg 0.5 calls/day18:00 — weekday avg 0.2, weekend avg 0.1 calls/day18h19:00 — weekday avg 0.2, weekend avg 0.5 calls/day20:00 — weekday avg 0.4, weekend avg 0.1 calls/day21:00 — weekday avg 0.2, weekend avg 0.2 calls/day21h22:00 — weekday avg 0.2, weekend avg 0.2 calls/day23:00 — weekday avg 0.3, weekend avg 0.2 calls/day

weekday average · weekend average, calls per day by hour. Hover for exact values.

Compared to its neighbours

NeighbourhoodCallsPer dayPriority
Yorkdale-Glen Park1223.97%
Englemount-Lawrence892.96%
Brookhaven-Amesbury672.212%
Downsview832.712%
Clanton Park1013.38%
Briar Hill-Belgravia361.211%

Adjacent neighbourhoods, August 2026. "Per day" averages over all 31 days; "Priority" is the share of P1–P2 calls.

The app shows recent events on a map with filters, neighbourhood boundaries, and notification options for this area.