The picture in August 2026
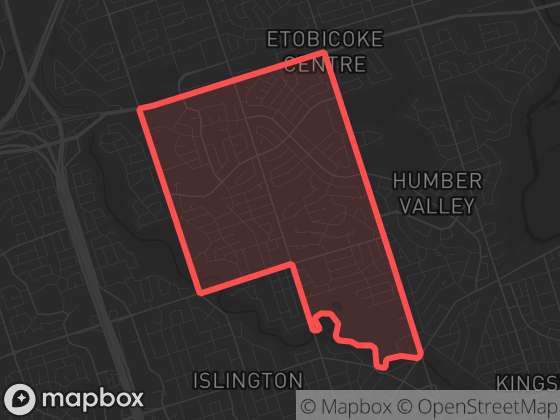
With 16 dispatched calls in August 2026, activity in Princess-Rosethorn was below the citywide median. The largest single category was Break & Enter In Progress, at 19% of all calls in the area. That is down 47% from the previous month's 30 calls. That is the area's quietest month since tracking began in December 2025.
Neighbourhood attribution uses the official boundary polygon shown here; calls without reliable coordinates are excluded from neighbourhood totals.
Monthly history
Dispatched calls per month in Princess-Rosethorn since December 2025. Hover a point for the exact count.
| Month | Calls | Priority |
|---|---|---|
| August 2026 | 16 | 6% |
| July 2026 | 30 | 3% |
| June 2026 | 21 | 10% |
| May 2026 | 16 | 19% |
| April 2026 | 20 | 20% |
| March 2026 | 18 | 0% |
| February 2026 | 18 | 11% |
| January 2026 | 21 | 0% |
| December 2025 | 26 | 4% |
Featured
Top call types
Full breakdown — all 12 call categories
New to dispatch data? Read what the call types mean and how to read neighbourhood statistics.
Time of day
Too few calls in August 1 – 31, 2026 (16) for meaningful time-of-day patterns here — see the citywide picture instead.
Compared to its neighbours
| Neighbourhood | Calls | Per day | Priority |
|---|---|---|---|
| Princess-Rosethorn | 16 | 0.5 | 6% |
| Islington | 64 | 2.1 | 6% |
| Edenbridge-Humber Valley | 69 | 2.2 | 6% |
| Eringate-Centennial-West Deane | 29 | 0.9 | 7% |
| Willowridge-Martingrove-Richview | 51 | 1.6 | 16% |
| Kingsway South | 42 | 1.4 | 12% |
Adjacent neighbourhoods, August 2026. "Per day" averages over all 31 days; "Priority" is the share of P1–P2 calls.
The app shows recent events on a map with filters, neighbourhood boundaries, and notification options for this area.