Dispatchr Open the app

Toronto · Neighbourhood dispatch report

North RiverdaleRecent emergency dispatch activity in Toronto's North Riverdale neighbourhood

Data period: September 1 – 30, 2026 · refreshed monthly Rank: #101 of 158 by call volume
61 ▼28%
Dispatched calls
4
Priority calls (P1–P2)
0.8×
vs citywide median
2.0
Avg calls / weekday
2.0
Avg calls / weekend day

The picture in September 2026
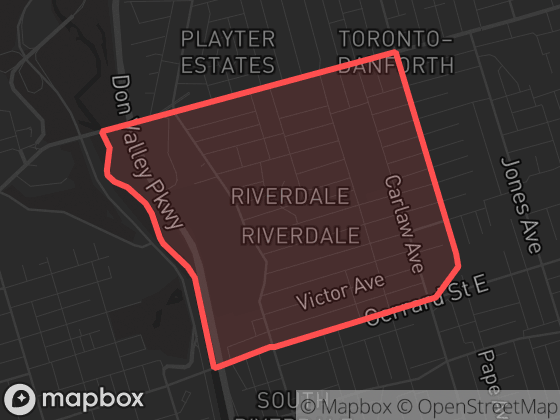
Map of North Riverdale in Toronto with its official boundary outlined

With 61 dispatched calls in September 2026, activity in North Riverdale was broadly in line with the citywide median. Disorderlies calls were the most common category, making up 25% of the neighbourhood's activity. Weekday and weekend days averaged a similar number of calls (2.0 vs 2.0 per day), with activity peaking around 10:00 local time. That is down 28% from the previous month's 85 calls. By the area's own recent standards, that is a typical month.

Neighbourhood attribution uses the official boundary polygon shown here; calls without reliable coordinates are excluded from neighbourhood totals.

Monthly history

December 2025 — 63 callsJanuary 2026 — 52 callsFebruary 2026 — 53 callsMarch 2026 — 63 callsApril 2026 — 56 callsMay 2026 — 83 callsJune 2026 — 49 calls49July 2026 — 70 callsAugust 2026 — 85 calls85September 2026 — 61 calls61December 2025September 2026

Dispatched calls per month in North Riverdale since December 2025. Hover a point for the exact count.

MonthCallsPriority
September 2026617%
August 2026858%
July 20267013%
June 20264910%
May 2026836%
April 20265618%
March 20266310%
February 2026536%
January 2026526%
December 20256313%

Featured

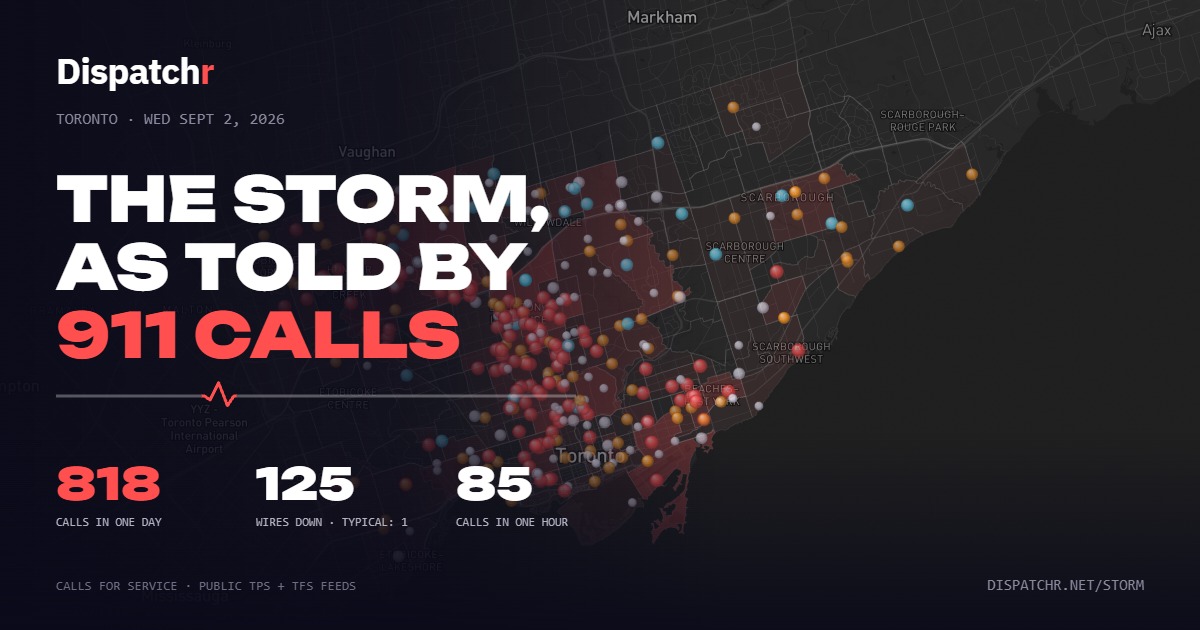
Map of Toronto with every storm-related 911 call from September 2, 2026 plotted as glowing dots
Toronto · Sept 2, 2026
The storm, as told by 911 calls
Replay September 2, 2026 minute by minute: 818 police and fire calls in one day, 125 wires down, two waves across the city.
Replay the storm →

Top call types

Full breakdown — all 27 call categories
Disorderlies15
Arrest4
Medical3
Fail To Remain Property Damage Collision3
Unknown Trouble3
Assault3
Traffic Injury3
Fire3
Vehicle Injury3
+ 18 rarer categories with fewer than 3 calls each (21 calls combined)

New to dispatch data? Read what the call types mean and how to read neighbourhood statistics.

Time of day

00:00–00:59 — 2 calls200h01:00–01:59 — 2 calls202:00–02:59 — 3 calls303:00–03:59 — 0 calls003h04:00–04:59 — 0 calls005:00–05:59 — 0 calls006:00–06:59 — 2 calls206h07:00–07:59 — 4 calls408:00–08:59 — 1 calls109:00–09:59 — 5 calls509h10:00–10:59 — 8 calls811:00–11:59 — 2 calls212:00–12:59 — 4 calls412h13:00–13:59 — 3 calls314:00–14:59 — 3 calls315:00–15:59 — 5 calls515h16:00–16:59 — 0 calls017:00–17:59 — 2 calls218:00–18:59 — 1 calls118h19:00–19:59 — 3 calls320:00–20:59 — 2 calls221:00–21:59 — 2 calls221h22:00–22:59 — 4 calls423:00–23:59 — 3 calls3

Calls by hour (local time), September 1 – 30, 2026. The highlighted bar is the busiest hour.

00:00 — weekday avg 0.0, weekend avg 0.1 calls/day00h01:00 — weekday avg 0.0, weekend avg 0.1 calls/day02:00 — weekday avg 0.1, weekend avg 0.1 calls/day03:00 — weekday avg 0.0, weekend avg 0.0 calls/day03h04:00 — weekday avg 0.0, weekend avg 0.0 calls/day05:00 — weekday avg 0.0, weekend avg 0.0 calls/day06:00 — weekday avg 0.0, weekend avg 0.1 calls/day06h07:00 — weekday avg 0.2, weekend avg 0.0 calls/day08:00 — weekday avg 0.0, weekend avg 0.0 calls/day09:00 — weekday avg 0.1, weekend avg 0.3 calls/day09h10:00 — weekday avg 0.3, weekend avg 0.1 calls/day11:00 — weekday avg 0.0, weekend avg 0.1 calls/day12:00 — weekday avg 0.1, weekend avg 0.1 calls/day12h13:00 — weekday avg 0.1, weekend avg 0.1 calls/day14:00 — weekday avg 0.1, weekend avg 0.1 calls/day15:00 — weekday avg 0.2, weekend avg 0.0 calls/day15h16:00 — weekday avg 0.0, weekend avg 0.0 calls/day17:00 — weekday avg 0.1, weekend avg 0.0 calls/day18:00 — weekday avg 0.0, weekend avg 0.0 calls/day18h19:00 — weekday avg 0.1, weekend avg 0.1 calls/day20:00 — weekday avg 0.0, weekend avg 0.1 calls/day21:00 — weekday avg 0.0, weekend avg 0.3 calls/day21h22:00 — weekday avg 0.1, weekend avg 0.1 calls/day23:00 — weekday avg 0.1, weekend avg 0.0 calls/day

— weekday average · — weekend average, calls per day by hour. Hover for exact values.

Compared to its neighbours

NeighbourhoodCallsPer dayPriority
North Riverdale612.07%
Cabbagetown-South St.James Town1695.69%
South Riverdale2337.86%
Playter Estates-Danforth1103.72%
Blake-Jones160.513%

Adjacent neighbourhoods, September 2026. "Per day" averages over all 30 days; "Priority" is the share of P1–P2 calls.

The app shows recent events on a map with filters, neighbourhood boundaries, and notification options for this area.