Dispatchr Open the app

Ottawa · Neighbourhood dispatch report

WestboroRecent emergency dispatch activity in Ottawa's Westboro neighbourhood

Data period: October 1 – 31, 2026 · refreshed monthly Rank: #5 of 111 by call volume
112 ▲8%
Dispatched calls
9
Priority calls (P1–P2)
7.0×
vs citywide median
3.9
Avg calls / weekday
3.0
Avg calls / weekend day

The picture in October 2026

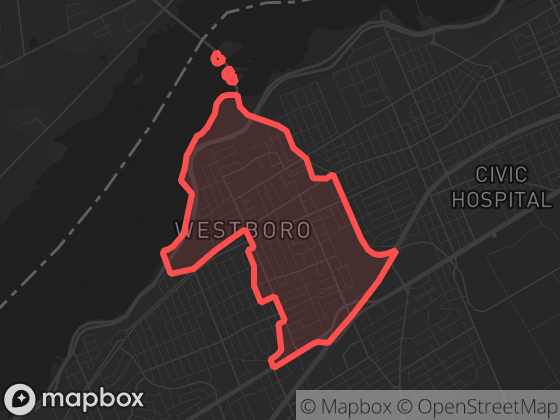
Map of Westboro in Ottawa with its official boundary outlined

With 112 dispatched calls in October 2026, activity in Westboro was among the busier areas of the city. Theft $5000 And Under calls were the most common category, making up 63% of the neighbourhood's activity. Weekdays averaged more calls than weekend days (3.9 vs 3.0 per day), with activity peaking around 20:00 local time. By the area's own recent standards, that is a typical month.

Neighbourhood attribution uses the official boundary polygon shown here; calls without reliable coordinates are excluded from neighbourhood totals.

Monthly history

January 2026 — 75 calls75February 2026 — 80 callsMarch 2026 — 93 callsApril 2026 — 101 callsMay 2026 — 99 callsJune 2026 — 118 callsJuly 2026 — 111 callsAugust 2026 — 121 calls121September 2026 — 104 callsOctober 2026 — 112 calls112January 2026October 2026

Dispatched calls per month in Westboro since January 2026. Hover a point for the exact count.
MonthCallsPriority
October 20261128%
September 20261048%
August 20261217%
July 20261117%
June 20261185%
May 2026996%
April 20261015%
March 2026933%
February 20268011%
January 2026757%

Top call types

Full breakdown — all 9 call categories
Theft $5000 And Under71
Mischief21
Assault7
Break And Enter7
+ 5 rarer categories with fewer than 3 calls each (6 calls combined)

New to dispatch data? Read what the call types mean and how to read neighbourhood statistics.

Time of day

00:00–00:59 — 1 calls100h01:00–01:59 — 0 calls002:00–02:59 — 0 calls003:00–03:59 — 1 calls103h04:00–04:59 — 0 calls005:00–05:59 — 0 calls006:00–06:59 — 1 calls106h07:00–07:59 — 0 calls008:00–08:59 — 5 calls509:00–09:59 — 6 calls609h10:00–10:59 — 5 calls511:00–11:59 — 3 calls312:00–12:59 — 7 calls712h13:00–13:59 — 5 calls514:00–14:59 — 5 calls515:00–15:59 — 8 calls815h16:00–16:59 — 7 calls717:00–17:59 — 12 calls1218:00–18:59 — 10 calls1018h19:00–19:59 — 12 calls1220:00–20:59 — 13 calls1321:00–21:59 — 8 calls821h22:00–22:59 — 3 calls323:00–23:59 — 0 calls0

Calls by hour (local time), October 1 – 31, 2026. The highlighted bar is the busiest hour.

00:00 — weekday avg 0.0, weekend avg 0.1 calls/day00h01:00 — weekday avg 0.0, weekend avg 0.0 calls/day02:00 — weekday avg 0.0, weekend avg 0.0 calls/day03:00 — weekday avg 0.0, weekend avg 0.0 calls/day03h04:00 — weekday avg 0.0, weekend avg 0.0 calls/day05:00 — weekday avg 0.0, weekend avg 0.0 calls/day06:00 — weekday avg 0.0, weekend avg 0.1 calls/day06h07:00 — weekday avg 0.0, weekend avg 0.0 calls/day08:00 — weekday avg 0.2, weekend avg 0.1 calls/day09:00 — weekday avg 0.3, weekend avg 0.0 calls/day09h10:00 — weekday avg 0.2, weekend avg 0.0 calls/day11:00 — weekday avg 0.1, weekend avg 0.0 calls/day12:00 — weekday avg 0.2, weekend avg 0.2 calls/day12h13:00 — weekday avg 0.2, weekend avg 0.0 calls/day14:00 — weekday avg 0.1, weekend avg 0.2 calls/day15:00 — weekday avg 0.3, weekend avg 0.2 calls/day15h16:00 — weekday avg 0.2, weekend avg 0.3 calls/day17:00 — weekday avg 0.4, weekend avg 0.3 calls/day18:00 — weekday avg 0.4, weekend avg 0.1 calls/day18h19:00 — weekday avg 0.3, weekend avg 0.6 calls/day20:00 — weekday avg 0.4, weekend avg 0.4 calls/day21:00 — weekday avg 0.3, weekend avg 0.2 calls/day21h22:00 — weekday avg 0.1, weekend avg 0.0 calls/day23:00 — weekday avg 0.0, weekend avg 0.0 calls/day

— weekday average · — weekend average, calls per day by hour. Hover for exact values.

Compared to its neighbours

NeighbourhoodCallsPer dayPriority
Westboro1123.68%
Island Park - Wellington Village140.57%
Laurentian571.85%
Carlingwood West - Glabar Park - McKellar Heights260.815%
Civic Hospital-Central Park140.514%
Carlington561.820%

Adjacent neighbourhoods, October 2026. "Per day" averages over all 31 days; "Priority" is the share of P1–P2 calls.

The app shows recent events on a map with filters, neighbourhood boundaries, and notification options for this area.