The picture in October 2026
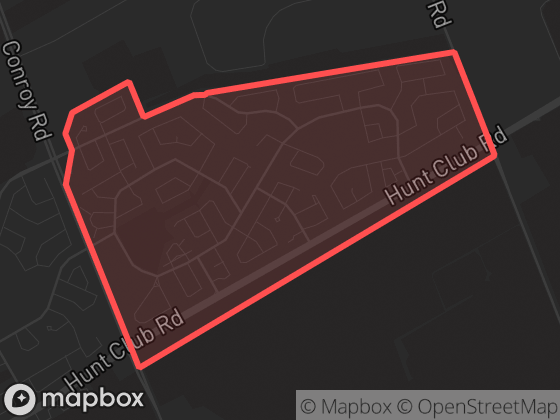
Hunt Club Park recorded 10 dispatched calls in October 2026, placing it 76 of 111 neighbourhoods and quieter than most Ottawa neighbourhoods. Assault calls were the most common category, making up 40% of the neighbourhood's activity.
Neighbourhood attribution uses the official boundary polygon shown here; calls without reliable coordinates are excluded from neighbourhood totals.
Monthly history
Dispatched calls per month in Hunt Club Park since January 2026. Hover a point for the exact count.
| Month | Calls | Priority |
|---|---|---|
| October 2026 | 10 | 40% |
| September 2026 | 6 | 33% |
| August 2026 | 6 | 17% |
| July 2026 | 10 | 0% |
| June 2026 | 15 | 47% |
| May 2026 | 5 | 40% |
| April 2026 | 7 | 14% |
| March 2026 | 9 | 33% |
| February 2026 | 5 | 20% |
| January 2026 | 4 | 50% |
Top call types
Full breakdown — all 5 call categories
New to dispatch data? Read what the call types mean and how to read neighbourhood statistics.
Time of day
Too few calls in October 1 – 31, 2026 (10) for meaningful time-of-day patterns here — see the citywide picture instead.
Compared to its neighbours
| Neighbourhood | Calls | Per day | Priority |
|---|---|---|---|
| Hunt Club Park | 10 | 0.3 | 40% |
| East Industrial | 62 | 2.0 | 13% |
| Greenbelt | 56 | 1.8 | 25% |
| Greenboro East | 18 | 0.6 | 6% |
Adjacent neighbourhoods, October 2026. "Per day" averages over all 31 days; "Priority" is the share of P1–P2 calls.
The app shows recent events on a map with filters, neighbourhood boundaries, and notification options for this area.