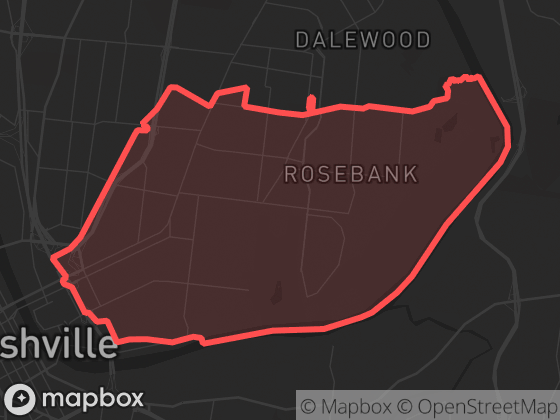
East NashvilleRecent emergency dispatch activity in Nashville's East Nashville neighbourhood
Data period: August 1 – 31, 2026 · refreshed monthlyRank: #10 of 27 by call volume
108 ▲7%
Dispatched calls
27
Priority calls (P1–P2)
1.6×
vs citywide median
3.1
Avg calls / weekday
4.3
Avg calls / weekend day
The picture in August 2026
In August 2026, East Nashville recorded 108 dispatched calls — busier than most Nashville neighbourhoods (ranked 10 of 27 neighbourhoods by volume). Burglary Alarm calls were the most common category, making up 54% of the neighbourhood's activity. Weekend days averaged more calls than weekdays (4.3 vs 3.1 per day), with activity peaking around 22:00 local time. By the area's own recent standards, that is a typical month.
Neighbourhood attribution uses the official boundary polygon shown here; calls without reliable coordinates are excluded from neighbourhood totals.
Monthly history
Dispatched calls per month in East Nashville since December 2025. Hover a point for the exact count.