The picture in August 2026
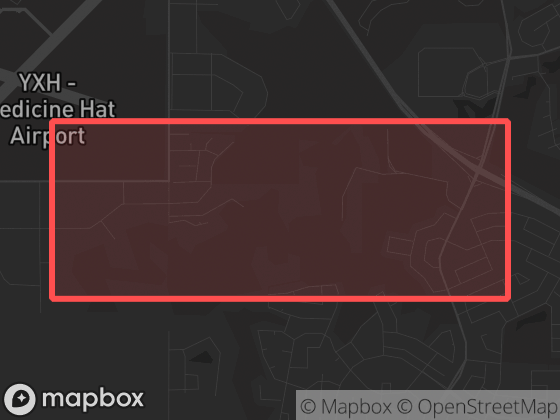
With 21 dispatched calls in August 2026, activity in South Flats was busier than most Medicine Hat neighbourhoods. Bylaw calls were the most common category, making up 48% of the neighbourhood's activity. That is up 62% from the previous month's 13 calls. That makes it the area's busiest month since tracking began in December 2025.
Neighbourhood attribution uses the official boundary polygon shown here; calls without reliable coordinates are excluded from neighbourhood totals.
Monthly history
Dispatched calls per month in South Flats since December 2025. Hover a point for the exact count.
| Month | Calls | Priority |
|---|---|---|
| August 2026 | 21 | 0% |
| July 2026 | 13 | 0% |
| June 2026 | 11 | 0% |
| May 2026 | 11 | 0% |
| April 2026 | 3 | 0% |
| March 2026 | 6 | 0% |
| February 2026 | 4 | 0% |
| January 2026 | 4 | 0% |
| December 2025 | 4 | 0% |
Top call types
Full breakdown — all 5 call categories
New to dispatch data? Read what the call types mean and how to read neighbourhood statistics.
Time of day
Time-of-day data isn't available for Medicine Hat. Medicine Hat Police Service publishes generalized (date-level) timestamps rather than precise event times, so hourly and weekday-vs-weekend patterns can't be computed. Counts, categories, locations, and monthly history are unaffected.
Compared to its neighbours
| Neighbourhood | Calls | Per day | Priority |
|---|---|---|---|
| South Flats | 21 | 0.7 | 0% |
| Crestwood | 13 | 0.4 | 0% |
| South Central Gap | 49 | 1.6 | 4% |
| Southview | 15 | 0.5 | 0% |
Adjacent neighbourhoods, August 2026. "Per day" averages over all 31 days; "Priority" is the share of P1–P2 calls.
The app shows recent events on a map with filters, neighbourhood boundaries, and notification options for this area.