The picture in August 2026
Vernor / Junction recorded 76 dispatched calls in August 2026, placing it 24 of 54 neighbourhoods and broadly in line with the citywide median. Unknown Problem calls were the most common category, making up 22% of the neighbourhood's activity. That is down 20% from the previous month's 95 calls.
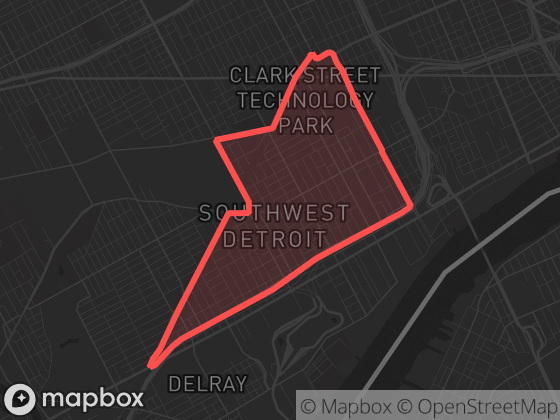
Neighbourhood attribution uses the official boundary polygon shown here; calls without reliable coordinates are excluded from neighbourhood totals.
Monthly history
June 2026 — 70 calls 70 July 2026 — 95 calls 95 August 2026 — 76 calls 76 June 2026 August 2026 Dispatched calls per month in Vernor / Junction since June 2026. Hover a point for the exact count.
Month Calls Priority August 2026 76 17% July 2026 95 16% June 2026 70 17%
Top call types
Full breakdown — all 23 call categories Unknown Problem 17
Hangup Call 16
Disturbance 13
Shots Fired (In Progress) 5
Felonious Assault (In Progress) 3
+ 18 rarer categories with fewer than 3 calls each (22 calls combined)
New to dispatch data? Read what the call types mean and how to read neighbourhood statistics .
Time of day
00:00–00:59 — 2 calls 2 00h 01:00–01:59 — 0 calls 0 02:00–02:59 — 0 calls 0 03:00–03:59 — 0 calls 0 03h 04:00–04:59 — 10 calls 10 05:00–05:59 — 2 calls 2 06:00–06:59 — 0 calls 0 06h 07:00–07:59 — 0 calls 0 08:00–08:59 — 0 calls 0 09:00–09:59 — 0 calls 0 09h 10:00–10:59 — 0 calls 0 11:00–11:59 — 0 calls 0 12:00–12:59 — 0 calls 0 12h 13:00–13:59 — 0 calls 0 14:00–14:59 — 0 calls 0 15:00–15:59 — 0 calls 0 15h 16:00–16:59 — 0 calls 0 17:00–17:59 — 0 calls 0 18:00–18:59 — 0 calls 0 18h 19:00–19:59 — 0 calls 0 20:00–20:59 — 0 calls 0 21:00–21:59 — 0 calls 0 21h 22:00–22:59 — 0 calls 0 23:00–23:59 — 0 calls 0 Calls by hour (local time), August 1 – 31, 2026. The highlighted bar is the busiest hour.
00:00 — weekday avg 0.1, weekend avg 0.0 calls/day 00h 01:00 — weekday avg 0.0, weekend avg 0.0 calls/day 02:00 — weekday avg 0.0, weekend avg 0.0 calls/day 03:00 — weekday avg 0.0, weekend avg 0.0 calls/day 03h 04:00 — weekday avg 0.2, weekend avg 0.5 calls/day 05:00 — weekday avg 0.1, weekend avg 0.0 calls/day 06:00 — weekday avg 0.0, weekend avg 0.0 calls/day 06h 07:00 — weekday avg 0.0, weekend avg 0.0 calls/day 08:00 — weekday avg 0.0, weekend avg 0.0 calls/day 09:00 — weekday avg 0.0, weekend avg 0.0 calls/day 09h 10:00 — weekday avg 0.0, weekend avg 0.0 calls/day 11:00 — weekday avg 0.0, weekend avg 0.0 calls/day 12:00 — weekday avg 0.0, weekend avg 0.0 calls/day 12h 13:00 — weekday avg 0.0, weekend avg 0.0 calls/day 14:00 — weekday avg 0.0, weekend avg 0.0 calls/day 15:00 — weekday avg 0.0, weekend avg 0.0 calls/day 15h 16:00 — weekday avg 0.0, weekend avg 0.0 calls/day 17:00 — weekday avg 0.0, weekend avg 0.0 calls/day 18:00 — weekday avg 0.0, weekend avg 0.0 calls/day 18h 19:00 — weekday avg 0.0, weekend avg 0.0 calls/day 20:00 — weekday avg 0.0, weekend avg 0.0 calls/day 21:00 — weekday avg 0.0, weekend avg 0.0 calls/day 21h 22:00 — weekday avg 0.0, weekend avg 0.0 calls/day 23:00 — weekday avg 0.0, weekend avg 0.0 calls/day — weekday average · — weekend average, calls per day by hour. Hover for exact values.
77% of calls in this feed carry a generalized (batch) timestamp; they are excluded from these time-of-day charts.
Compared to its neighbours
Adjacent neighbourhoods, August 2026. "Per day" averages over all 31 days; "Priority" is the share of P1–P2 calls.
The app shows recent events on a map with filters, neighbourhood boundaries, and notification options for this area.