The picture in September 2026
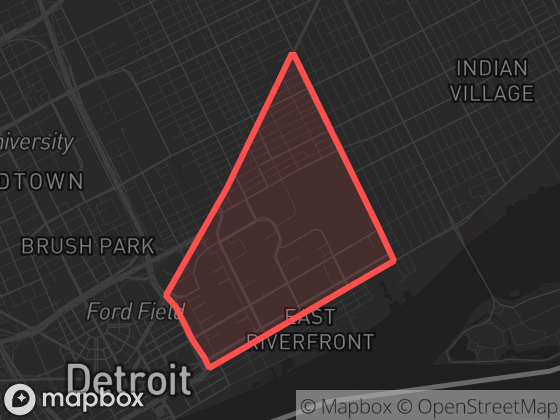
In September 2026, Lower East Central recorded 33 dispatched calls — broadly in line with the citywide median (ranked 31 of 54 neighbourhoods by volume). Disturbance calls were the most common category, making up 42% of the neighbourhood's activity. That is down 51% from the previous month's 67 calls. That is the area's quietest month since tracking began in June 2026.
Neighbourhood attribution uses the official boundary polygon shown here; calls without reliable coordinates are excluded from neighbourhood totals.
Monthly history
Dispatched calls per month in Lower East Central since June 2026. Hover a point for the exact count.
| Month | Calls | Priority |
|---|---|---|
| September 2026 | 33 | 15% |
| August 2026 | 67 | 27% |
| July 2026 | 95 | 29% |
| June 2026 | 118 | 26% |
Top call types
Full breakdown — all 11 call categories
New to dispatch data? Read what the call types mean and how to read neighbourhood statistics.
Time of day
Calls by hour (local time), September 1 – 30, 2026. The highlighted bar is the busiest hour.
84% of calls in this feed carry a generalized (batch) timestamp; they are excluded from these time-of-day charts.
Compared to its neighbours
| Neighbourhood | Calls | Per day | Priority |
|---|---|---|---|
| Lower East Central | 33 | 1.1 | 15% |
| Middle East Central | 22 | 0.7 | 23% |
| Butzel | 23 | 0.8 | 30% |
| Central Business District | 100 | 3.3 | 15% |
| Near East Riverfront | 27 | 0.9 | 11% |
| Kettering | 18 | 0.6 | 44% |
Adjacent neighbourhoods, September 2026. "Per day" averages over all 30 days; "Priority" is the share of P1–P2 calls.
The app shows recent events on a map with filters, neighbourhood boundaries, and notification options for this area.