Dispatchr Open the app

Dallas · Neighbourhood dispatch report

Northeast DallasRecent emergency dispatch activity in Dallas's Northeast Dallas neighbourhood

Data period: June 1 – 30, 2026 · refreshed monthly Rank: #5 of 24 by call volume
1,336
Dispatched calls
52
Priority calls (P1–P2)
1.9×
vs citywide median
43.4
Avg calls / weekday
47.6
Avg calls / weekend day

The picture in June 2026

Northeast Dallas recorded 1,336 dispatched calls in June 2026, placing it 5 of 24 neighbourhoods and busier than most Dallas neighbourhoods. Other Call calls were the most common category, making up 26% of the neighbourhood's activity. Weekday and weekend days averaged a similar number of calls (43.4 vs 47.6 per day), with activity peaking around 15:00 local time.

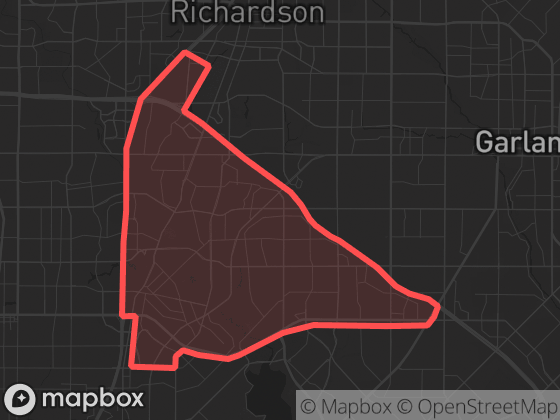
Neighbourhood attribution uses the official boundary polygon shown here; calls without reliable coordinates are excluded from neighbourhood totals.

Top call types

Full breakdown — all 74 call categories
Other Call352
Major Disturbance (Violence)345
Business Alarm75
Suspicious Person74
Crisis Intervention42
Major Accident28
Minor Accident25
Loud Music Disturbance22
Residential Alarm22
Street Blockage22
Burglary Of Residence20
Abandoned Property20
Major Disturbance (Ambulance)18
Minor Disturbance15
911 Hang Up14
Random Gun Fire13
Disturbance (Emergency)13
Burg Res In Progress12
Police Requested By Fire Department12
Business Hold Up12
Theft10
Disturbance Emerg Amb9
Major Accident (Freeway)9
Res Panic Alarm9
Meet Complainant8
Disturbance / Armed Encounter On Foot8
Injured Person6
Burg Motor Veh6
Burg Of Bus6
Bmv-In Progress6
Missing Person-Critical6
Prowler5
Burglary At Business (In Progress)5
Freeway Blockage4
Prisoner4
Kidnapping In Progress4
Crisis Intervention (With Ambulance)4
Robbery (Report)+1hr4
Unauthorized Use Of Motor Vehicle4
Animal Attack4
Stabbing, Cutting4
Dist Active Shooter Foot4
Burg Of Res3
City Equipment Accident3
Robbery - In Progress3
+ 29 rarer categories with fewer than 3 calls each (42 calls combined)

New to dispatch data? Read what the call types mean and how to read neighbourhood statistics.

Time of day

00:00–00:59 — 51 calls5100h01:00–01:59 — 54 calls5402:00–02:59 — 35 calls3503:00–03:59 — 36 calls3603h04:00–04:59 — 39 calls3905:00–05:59 — 30 calls3006:00–06:59 — 28 calls2806h07:00–07:59 — 53 calls5308:00–08:59 — 41 calls4109:00–09:59 — 57 calls5709h10:00–10:59 — 47 calls4711:00–11:59 — 57 calls5712:00–12:59 — 48 calls4812h13:00–13:59 — 58 calls5814:00–14:59 — 60 calls6015:00–15:59 — 94 calls9415h16:00–16:59 — 79 calls7917:00–17:59 — 68 calls6818:00–18:59 — 68 calls6818h19:00–19:59 — 52 calls5220:00–20:59 — 51 calls5121:00–21:59 — 88 calls8821h22:00–22:59 — 88 calls8823:00–23:59 — 54 calls54

Calls by hour (local time), June 1 – 30, 2026. The highlighted bar is the busiest hour.

00:00 — weekday avg 1.9, weekend avg 1.3 calls/day00h01:00 — weekday avg 1.8, weekend avg 1.8 calls/day02:00 — weekday avg 1.0, weekend avg 1.5 calls/day03:00 — weekday avg 1.0, weekend avg 1.6 calls/day03h04:00 — weekday avg 1.2, weekend avg 1.6 calls/day05:00 — weekday avg 1.0, weekend avg 1.1 calls/day06:00 — weekday avg 0.9, weekend avg 1.0 calls/day06h07:00 — weekday avg 1.8, weekend avg 1.8 calls/day08:00 — weekday avg 1.2, weekend avg 1.8 calls/day09:00 — weekday avg 2.0, weekend avg 1.5 calls/day09h10:00 — weekday avg 1.5, weekend avg 1.8 calls/day11:00 — weekday avg 1.9, weekend avg 2.0 calls/day12:00 — weekday avg 1.5, weekend avg 1.9 calls/day12h13:00 — weekday avg 2.1, weekend avg 1.5 calls/day14:00 — weekday avg 1.9, weekend avg 2.3 calls/day15:00 — weekday avg 2.9, weekend avg 3.8 calls/day15h16:00 — weekday avg 2.9, weekend avg 2.0 calls/day17:00 — weekday avg 2.3, weekend avg 2.3 calls/day18:00 — weekday avg 2.0, weekend avg 3.0 calls/day18h19:00 — weekday avg 1.7, weekend avg 1.9 calls/day20:00 — weekday avg 1.7, weekend avg 1.8 calls/day21:00 — weekday avg 2.7, weekend avg 3.5 calls/day21h22:00 — weekday avg 2.8, weekend avg 3.3 calls/day23:00 — weekday avg 1.7, weekend avg 2.0 calls/day

weekday average · weekend average, calls per day by hour. Hover for exact values.

Compared to its neighbours

NeighbourhoodCallsPer dayPriority
Northeast Dallas1,33644.54%

Adjacent neighbourhoods, June 2026. "Per day" averages over all 30 days; "Priority" is the share of P1–P2 calls.

The app shows recent events on a map with filters, neighbourhood boundaries, and notification options for this area.