Dispatchr Open the app

Cincinnati · Neighbourhood dispatch report

Mt. AuburnRecent emergency dispatch activity in Cincinnati's Mt. Auburn neighbourhood

Data period: October 1 – 31, 2026 · refreshed monthly Rank: #19 of 50 by call volume
779
Dispatched calls
50
Priority calls (P1–P2)
1.5×
vs citywide median
25.9
Avg calls / weekday
23.3
Avg calls / weekend day

Data note: From October 19, 2026, the source feed records Cincinnati police calls more completely and names call types differently, so October 2026 mixes two recordings: it isn't compared with other months here, and monthly history restarts from November 2026.

The picture in October 2026

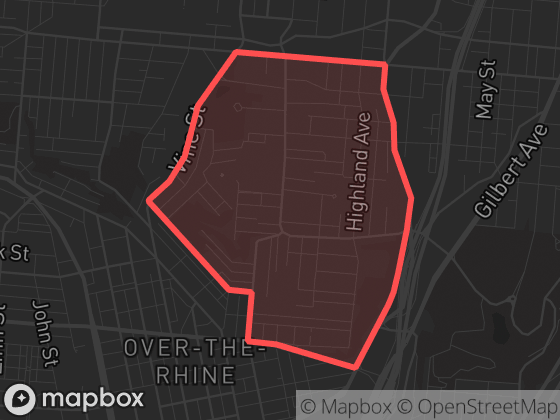
Map of Mt. Auburn in Cincinnati with its official boundary outlined

With 779 dispatched calls in October 2026, activity in Mt. Auburn was above the citywide median. The largest single category was Information Call (No Dispatch), at 15% of all calls in the area. Weekday and weekend days averaged a similar number of calls (25.9 vs 23.3 per day), with activity peaking around 10:00 local time.

Neighbourhood attribution uses the official boundary polygon shown here; calls without reliable coordinates are excluded from neighbourhood totals.
Top call types

Full breakdown — all 95 call categories
Information Call (No Dispatch)113
Public Works Request82
911 Open Line (No Dispatch)75
Parking Complaint40
Disorderly Conduct36
Theft30
Traffic Stop26
Administrative Call23
Information Call19
911 Open Line18
Domestic Dispute (Violent)17
Vehicle Complaint16
Unspecified Police Call16
Unknown Trouble15
Person In Crisis14
Burglar Alarm12
Trespassing12
Shots Fired12
Noise Complaint11
Wanted Person11
Assault11
911 Silent Or Unknown Call10
Suspicious Person9
Burglary7
Vandalism7
Suspicious Activity6
Wellbeing Check6
Special Detail6
Threatening Behavior6
Advised Incident5
Officer Status Check4
Road Damage4
Pedestrian Stop4
Traffic Hazard4
Vehicle Crash (Injury Unknown)4
Runaway4
Vehicle Crash4
Animal Complaint4
311 Info/Assist3
Vehicle Crash (Injury)3
Sexual Assault3
311 Request3
+ 53 rarer categories with fewer than 3 calls each (64 calls combined)

New to dispatch data? Read what the call types mean and how to read neighbourhood statistics.

Time of day

00:00–00:59 — 13 calls1300h01:00–01:59 — 19 calls1902:00–02:59 — 17 calls1703:00–03:59 — 30 calls3003h04:00–04:59 — 22 calls2205:00–05:59 — 5 calls506:00–06:59 — 10 calls1006h07:00–07:59 — 20 calls2008:00–08:59 — 43 calls4309:00–09:59 — 46 calls4609h10:00–10:59 — 52 calls5211:00–11:59 — 37 calls3712:00–12:59 — 39 calls3912h13:00–13:59 — 51 calls5114:00–14:59 — 45 calls4515:00–15:59 — 45 calls4515h16:00–16:59 — 43 calls4317:00–17:59 — 35 calls3518:00–18:59 — 32 calls3218h19:00–19:59 — 43 calls4320:00–20:59 — 31 calls3121:00–21:59 — 22 calls2221h22:00–22:59 — 44 calls4423:00–23:59 — 35 calls35

Calls by hour (local time), October 1 – 31, 2026. The highlighted bar is the busiest hour.

00:00 — weekday avg 0.5, weekend avg 0.3 calls/day00h01:00 — weekday avg 0.6, weekend avg 0.6 calls/day02:00 — weekday avg 0.4, weekend avg 0.9 calls/day03:00 — weekday avg 0.5, weekend avg 2.2 calls/day03h04:00 — weekday avg 0.5, weekend avg 1.3 calls/day05:00 — weekday avg 0.1, weekend avg 0.2 calls/day06:00 — weekday avg 0.4, weekend avg 0.1 calls/day06h07:00 — weekday avg 0.7, weekend avg 0.6 calls/day08:00 — weekday avg 1.6, weekend avg 0.8 calls/day09:00 — weekday avg 1.6, weekend avg 1.1 calls/day09h10:00 — weekday avg 2.0, weekend avg 1.0 calls/day11:00 — weekday avg 1.4, weekend avg 0.7 calls/day12:00 — weekday avg 1.5, weekend avg 0.8 calls/day12h13:00 — weekday avg 1.7, weekend avg 1.4 calls/day14:00 — weekday avg 1.5, weekend avg 1.2 calls/day15:00 — weekday avg 1.5, weekend avg 1.2 calls/day15h16:00 — weekday avg 1.7, weekend avg 0.7 calls/day17:00 — weekday avg 1.1, weekend avg 1.2 calls/day18:00 — weekday avg 0.8, weekend avg 1.6 calls/day18h19:00 — weekday avg 1.4, weekend avg 1.3 calls/day20:00 — weekday avg 1.2, weekend avg 0.6 calls/day21:00 — weekday avg 0.8, weekend avg 0.4 calls/day21h22:00 — weekday avg 1.3, weekend avg 1.7 calls/day23:00 — weekday avg 1.0, weekend avg 1.4 calls/day

— weekday average · — weekend average, calls per day by hour. Hover for exact values.

Compared to its neighbours

NeighbourhoodCallsPer dayPriority
Mt. Auburn77925.16%
Walnut Hills1,57150.76%
CUF2,02165.24%
Pendleton2628.56%
Over-the-Rhine1,98564.05%
Corryville1,14336.96%

Adjacent neighbourhoods, October 2026. "Per day" averages over all 31 days; "Priority" is the share of P1–P2 calls.

The app shows recent events on a map with filters, neighbourhood boundaries, and notification options for this area.