August 1 – 31, 2026 is an incomplete month for Chicago. The source feed published nothing after August 20, and carried calls on only 6 of the month's 31 days. The 89 calls published for the month are below the 100 this section normally requires, so the figures below are thinner than usual. Everything here counts what was published, which undercounts the month — treat it as a partial picture, not a quiet one, and don't compare it with other months or other cities. Month-over-month change is not shown for this period.
The picture in August 2026
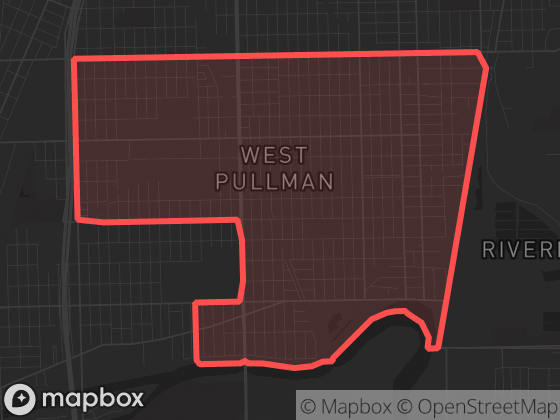
Of the calls published for August 2026, 1 was attributed to West Pullman — 45 of 98 neighbourhoods on that partial data.
Neighbourhood attribution uses the official boundary polygon shown here; calls without reliable coordinates are excluded from neighbourhood totals.
Monthly history
Dispatched calls per month in West Pullman since May 2026. Hover a point for the exact count.
| Month | Calls | Priority |
|---|---|---|
| August 2026 | 1 | 0% |
| July 2026 | 1 | 0% |
| June 2026 | 7 | 0% |
| May 2026 | 6 | 0% |
Top call types
Too few calls for a category breakdown — categories with fewer than 3 calls aren't itemized (see methodology).
New to dispatch data? Read what the call types mean and how to read neighbourhood statistics.
Time of day
Time-of-day data isn't available for Chicago. Chicago Police Department publishes generalized (date-level) timestamps rather than precise event times, so hourly and weekday-vs-weekend patterns can't be computed. Counts, categories, locations, and monthly history are unaffected.
Compared to its neighbours
| Neighbourhood | Calls | Per day | Priority |
|---|---|---|---|
| West Pullman | 1 | 0.0 | 0% |
| Roseland | 3 | 0.1 | 33% |
| Morgan Park | 0 | 0.0 | 0% |
| Riverdale | 1 | 0.0 | 0% |
Adjacent neighbourhoods, August 2026. "Per day" averages over all 31 days; "Priority" is the share of P1–P2 calls.
The app shows recent events on a map with filters, neighbourhood boundaries, and notification options for this area.